Challenger Gold Mine - Calcrete Anomaly Exploration Success
- Veronica Lind

- Nov 22, 2019
- 9 min read
Updated: Oct 9, 2025

The Challenger Gold Mine Story
The Challenger Gold Project is one of these forgotten projects that has more to give than people realise. The Challenger gold deposit is 750 km north-northwest of Adelaide in Archaean rocks of the Gawler Craton. The Challenger Mine is the most significant gold-only discovery made in South Australia. It took over three years of exploration to discover the ore body in 1995 by Dominion Mining Limited. They used what was then a new form of geochemical sampling called “calcrete” sampling.
A regional sampling grid of 1.6km x 1.6km was used to cover the tenement area. The sampling anomaly was followed up with drilling to test the calcrete geochemical anomalies. After the discovery continued reconnaissance and infill calcrete sampling has defined over 300 calcrete gold anomalies over an area of approximately 10,000 km². Drilling of 50 of these prospects has revealed numerous occurrences of gold mineralisation but failed to define any further mineable reserves.

One of the many hundreds of samples was the “lucky” sample and recorded above background values of gold in calcrete. That lucky sample led to the discovery of what is now a mine that produced 1M ounces of gold since mining started in 2002. Like many discoveries, the initial drilling intersected high-grade ore, but subsequent drilling was not consistent.
Infilling of the regional sampling grids occurred by progressively decreasing the size of the patterns down to 400 m × 400 m then 100 m × 50 m, eventually homing in on the Challenger gold and arsenic anomaly. An initial RAB drilling program targeting the calcrete anomaly delivered an intersection of 28 m @ 5.8 g/t, which launched the Challenger project. (Androvic, P, Bamford, P, Sandt, M, The Challenger Gold Mine, 2008).

More detailed drilling with detailed structural interpretation led to the discovery of a series of tightly folded linear shoots. Mineralisation occurred as discrete shallowly (30° to 45°) plunging shoots hosted by granulite-facies paragneiss, which lacks marker horizons to aid in geological and structural mapping. High-grade moderate to steeply dipping auriferous quartz veins occur within the shoots.

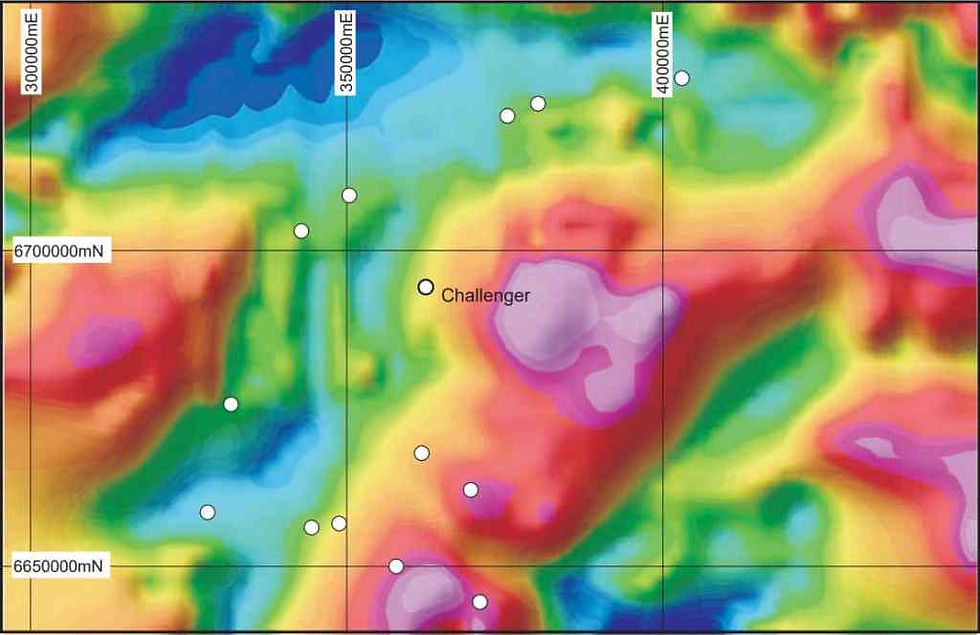
Geophysical Signatures
What is interesting is that no significant structures are observable in the area in regional (400 m line spacing) aeromagnetic data. Most of the people I have spoken to tell me that there are no visible geophysical signs of the deposit. The diagrams below show the difficulties in using geophysics as a tool. There is some slight inference to the deposit, but like all hindsight theories, they are useless in real-life exploration.

The gravity data show more detail, but it is not a great use for identifying a target.
The Mining of Challenger
Challenger started as an open pit in 2002 and was mined to a depth of 135m and completed in April 2004. A total of 120,000 ounces of gold was mined. Due to the massive nature of the Challenger gneiss, the mining process was complicated. The poor natural fracturing and indistinct geology in the pit resulted in the problematic interpretation of ore zones. This lead to poor geological control. The actual structural geometry of the ore was not apparent during the open-pit mining period as no ore was exposed for mapping in the early part of the mining process.
The folded nature of the ore was known, but the complexity of the ore was not fully realised. What was suitable for the mine was the “free dig” nature of the top 33m of the weathering profile. Challenger is a structural monster, and a laterally extensive shear zone defines the orebody with shoots plunging 30º to 030º – 035° (AMG) or 055° – 060° mine grid.

Speaking to some people who have worked in Challenger, they tell me the mine is called Challenger for a reason. The complexity would have caused a lot of dilution during the mining of the ore body. There are at least ten different known types of ore geometry, and I would not doubt that there would be even more that have not observed.
In 2001, Challenger had a reserve of 110,000oz of contained gold and the mine produced over 460,000 oz up to June 2008. In the three financial years to 30 June 2008, the mine produced 325, 600 oz from 1.18M tonnes at an average grade of 9.1 g/t. The average operating cost was $319/oz (Not sure if the author is quoting in AUD or USD). That is an incredible costing. Remember that the gold price was just over USD400 in 2005 and about USD800 in 2008.
Today, Challenger has produced over 1.1M oz of gold which is a testament to the endowment of the mine.
What’s the upside?
As my “devoted” readers know, I am all about exploration and the opportunity to find new deposits. I wrote about these opportunities many times such as Bellevue Gold Limited (ASX: BGL) and their Bellevue Gold Mine (Best Way to Find a Gold Mine: Bellevue Gold Project, an Exploration Success), Breaker Resources Limited (ASX: BRB) and their Bombora Project(Best way to find a Gold Mine: A Mineral Exploration Success) and the recently taken over Echo Resources Limited (ASX:EAR) (Echo Resources (ASX: EAR) – King of the Yandal Province).
These stories are what excites me about the Challenger area. The last concentrated exploration effort would have been the period up to the discovery of Challenger in the late 1990s. All exploration would have stopped post-2000. During the search for Challenger, Dominion discovered several satellite prospects that were followed up by Southern Gold Limited (ASX: SAU). In 24th February 2010, SAU announced their maiden JORC-compliant Gold Resources of 102,600oz within the Challenger Area Gold JV. Trafford Resources Limited which is now Tyranna Resources Limited (ASX: TYX) took over the leases and had more exploration success and announced a JORC 2012 resource of 319,000oz over the JV leases.
These two companies have made these discoveries based upon the work from the Dominion days while they were fine-tuning the discovery of Challenger. The lack of activity over the years is why I am excited. That’s one mine, 1.2M oz mined and not much else. If you were to draw a 100km radius around challenger, you would not find anything. In the Kalgoorlie and the Menzies area of the Eastern Goldfields of Western Australia, you would find thousands of operations.
Comparing statistics, the same 100km radius around two well-known mining district in the Eastern Goldfields, Kalgoorlie and Menzies, you get a very different picture. There is one mine at Challenger while you have over 4,000 “mining activities” around Kalgoorlie and over 2,000 around Menzies area (Mining Activities = Mines that are classified as Shut, Proposed, Operating or Care and maintenance. Mindex Data from Department of Mines, Western Australia.)
And when you look at Australia’s gold operations, it is even bleaker. The figure below does not even show Challenger as the big yellow circle is Olympic Dam. As many would know, I am an exploration geologist, and I look out for projects that have long legs for opportunities and have a cheap entry. To me, the Challenger area has lots of potentials (comes with lots of money required to explore) and the supergene deposits that are being discovered by Tyranna and Mamota Resources Limited (ASX: MEU) are what is the cream.
These kind of deposits were all the rage in the 1980s in the Eastern Goldfields and is now an extinct creature. All the supergene low hanging fruits would have been taken out in the 1980s and 1990s. As one would expect, the concentration in activities is directly correlated to the quality of infrastructure. It is no secret that the mining infrastructure in and around the Eastern Goldfields are all an A-grade level.
For this reason, Challenger is still “untouched” and the primary factor has been the remoteness and the lack of exploration funding since the 1990s. The Challenger area is remote and if not for the robustness of the gold price, we would not be even entertaining this prospect.

The best example of a similar scenario is when Gold Road Resources Limited (ASX: GOR) took up practically the whole Yamarna Greenstone Belt. At a time not too distant away, it was felt that the greenstone belt in the Yamarna was of different age and tectonic sequence and hence would not be mineralised like the Norseman-Wiluna belt. Well, 6.6Moz resource of which 3.9Moz is in Reserve later, this belt is pretty well endowed with gold. It is not too hard to think that this Challenger area could be that. There are more facts that there is more to find then there are facts to disprove this theory. Work by Tyranna Resources is factual evidence that the supergene mineralisation scenario is well and truly alive and well.

The Samso Way – Seek the Research
Our mission is simple: cut through the noise and spotlight what matters—genuine stories, grounded insights, and real opportunity.
Our content is well-researched and is only created if the team sees a merit in discussing the company or concept. Investors can explore our three core platforms:
There may be numerous paths to success in investing, but the common thread among successful individuals is that they remain committed to making informed decisions. Equip yourself with the right knowledge and tools, and you will be well on your way to achieving your financial goals.
Most importantly, investors need to be absolutely diligent in understanding their own risk-reward tolerance and capabilities. Never bite off more than you can chew. As they say, Rome wasn’t built in a day, and the Great Wall stood because it took centuries to complete.
The Samso Philosophy:
Stay curious. Stay sharp. And remember—digging deeper always uncovers the real value.
In Life, there is no such thing as a Free Lunch.
Happy Investing, and the only four-letter word you need to know is DYOR.
To support our independent nature of our work, please head over to our Support Page and give us a helping hand in any of the ways listed. This is a new initiate for the Samso Platform, and it was always the concept of Samso when we started this journey in 2018.
Disclaimer
The information or opinions provided herein do not constitute investment advice, an offer or solicitation to subscribe for, purchase or sell the investment product(s) mentioned herein. It does not take into consideration, nor have any regard to your specific investment objectives, financial situation, risk profile, tax position and particular, or unique needs and constraints.
Share to Grow: Your Bonus
Samso has just released an eBook: How to Add Value to your Share Portfolio
A lesson on geological models sought by mining companies that gives insight and an understanding of which portfolios are better - and potentially more lucrative – investments. Click here to download this eBook.

If you find this article informative and useful, please help me share the information. I try and write about topics that are interesting and have the potential to be of investment value. It is not easy to find stories that fit those parameters. If you or your organisation see the benefit of what Samso is trying to achieve and have a need to share your journey, please contact me at noel.ong@samso.com.au.
Samso is a trusted platform that equips dedicated investors with up-to-date industry knowledge and insights from top CEOs and thought leaders. By staying informed on business advancements and market trends, investors can enhance their financial decisions through a combination of expert guidance and their own research.


Comments